Traditional technical analysis teaches us that support and resistance are static lines drawn across historical price peaks and troughs. But if you’ve traded the Nifty or global indices recently, you’ve likely noticed a frustrating trend: standard breakout patterns are increasingly failing, resulting in “bull traps” or sudden, sharp stop-loss hunts before the real move happens.
Why is this happening? The answer lies in the dominant force in today’s markets: Algorithmic and AI-driven institutional trading.
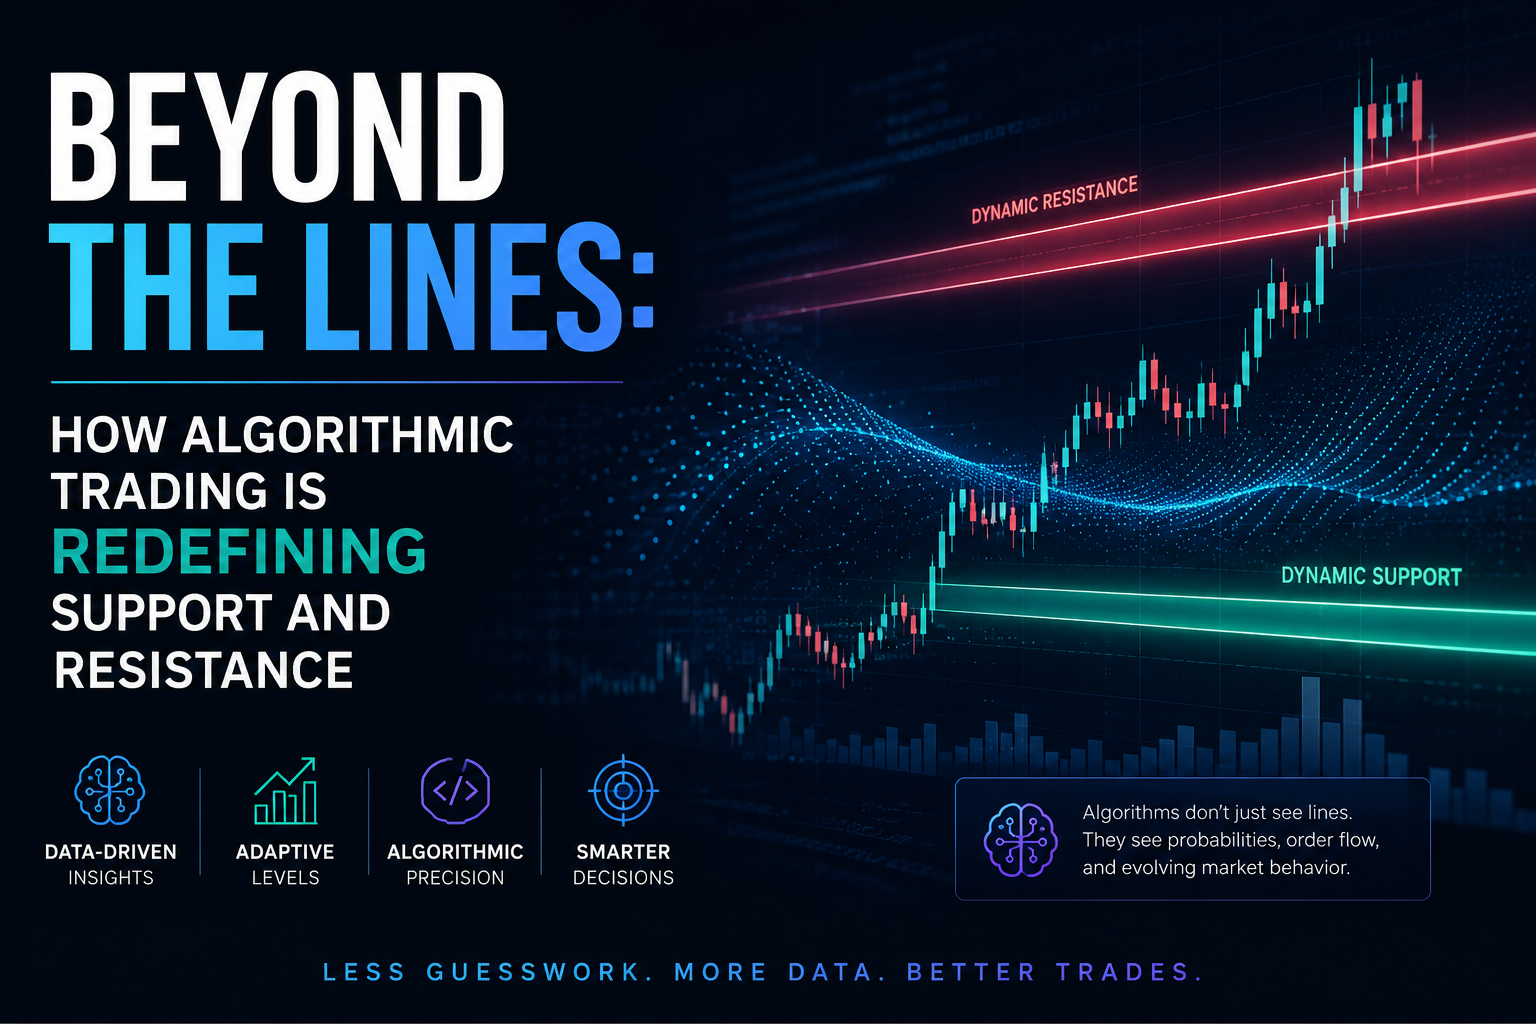
The Shift from Static Lines to Liquidity Pools
Algorithms do not look at retail chart patterns the way humans do. Instead, they operate on liquidity hunting.
Standard retail trading behavior places heavy clusters of stop-loss orders just below key support levels or right above visible resistance lines. Institutional AI models are programmed to detect these clusters, temporarily push the price into them to absorb that liquidity (filling their own large orders), and then rapidly reverse the price direction.
How to Adapt Your Strategy
To survive a market dominated by machine learning models, traders must pivot their technical analysis:
- Trade Zones, Not Lines: Never treat support or resistance as a single price point. Define a 0.5% to 1% volatility band around the level where algorithms are likely to hunt for orders.
- Watch the Volume Profile: Look for volume at price rather than just volume over time. True institutional support is marked by high-volume nodes where heavy accumulation occurs, not just a historical price bounce.
- Wait for the Re-test: In an algo-driven environment, trading the initial breakout is highly risky. Wait for the market to sweep the liquidity, break out, and successfully retest the level on declining volume before entering.
Read: THE LIQUIDITY CYCLE: How Global Money Flows Create Booms, Busts, and Investment Opportunities: An Institutional-Grade Guide to Profiting from Global Liquidity Cycles